
We all got so granular over the past few years! And that’s a good thing!
Rather than shotgunning our message all over God’s Green Earth (and paying a hefty toll for the privilege), we started looking at our marketplaces through a magnifying glass. Instead of marketing by Zip Code, we started breaking down the Zips by Carrier Route.
Most Help-U-Sell offices refined their marketing targets down to 5 to 10 Carrier Routes, depending on turnover rate and budget (That usually works out to 3,000 to 8,000 households). The problem is, since every Carrier Route has its own turnover rate, it became difficult to know what the OVERALL turnover rate was in your complete target. Most Brokers just kinda guessed.
Does that make any sense? You just spent all this time and energy carefully tearing your marketplace apart so that you could construct a productive target. Instead of doing what most Brokers do (which is to guess or make the decision based on hearsay or gut), you based the whole process on FACTS. Cold hard FACTS. And now, you’re going to guess at the turnover rate within your target? I think NOT!
So, here’s what you do:
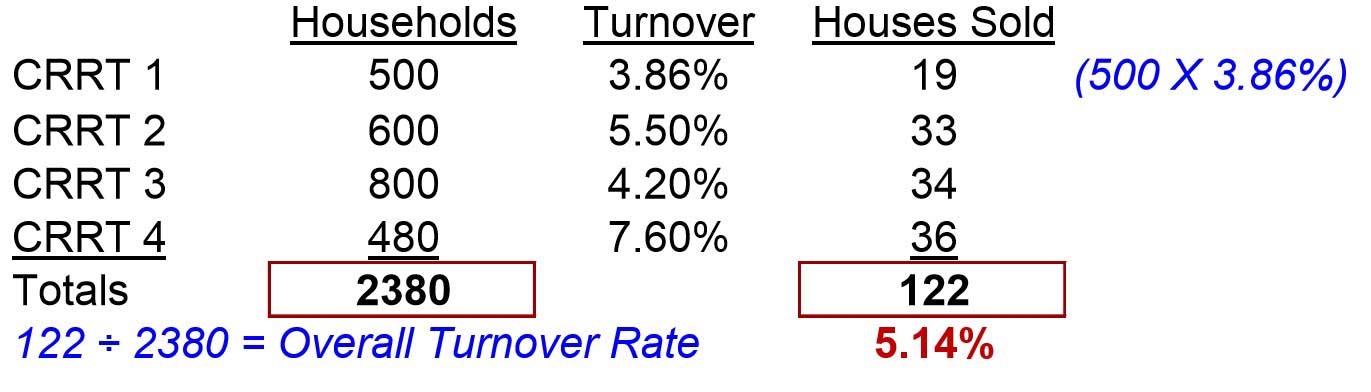
Add up all of the households in all of your Carrier Routs, then add all of the houses that sold in the past 12 months in all of the Carrier Routes . . . . Then just divide Homes Sold (the small number) by Households (the large number).
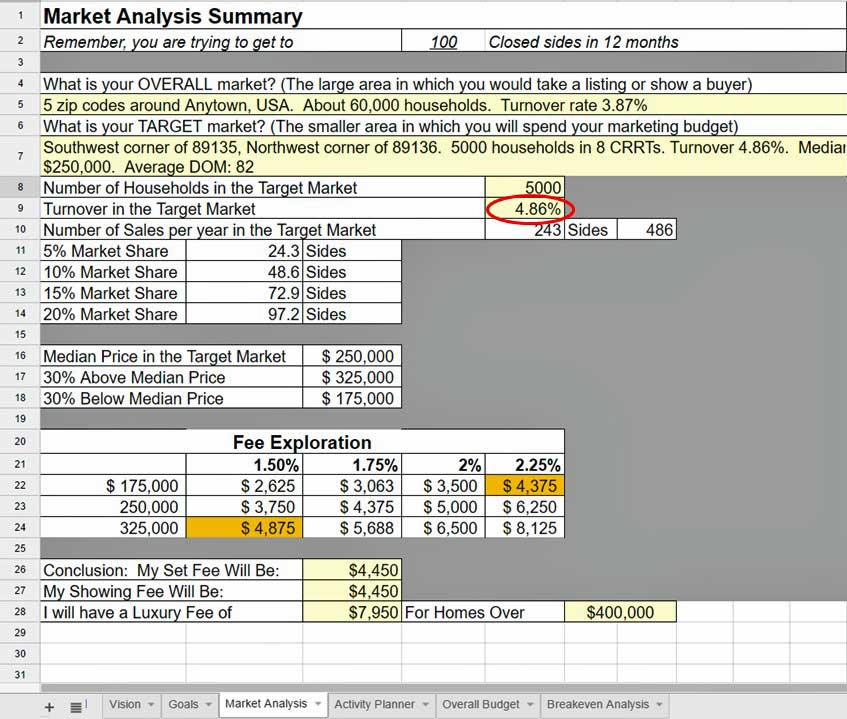
Those of you in a Coaching Group can use this AMAZING number in the Market Analysis tab of your 12 Month Goal Setting Worksheet, here:
I sincerely hope this keeps you guys from guessing about your business! And maybe the whole process will intrigue some into investigating the Coaching Group opportunity. I hope so. We’ve got openings.