Here’s a little statistical analysis for you, courtesy of NAR. First is a chart comparing rates of homeownership by age group in 2004 with the second quarter of 2010:
 The blue line is the 2004 rate, the green is 2010 and the yellow is the % difference in the two. What’s important is that homeownership has declined for every age group since 2004 with the biggest decline occurring in the under 35 group. The good news: there’s a whole lotta folks out there who NEED to buy a home!
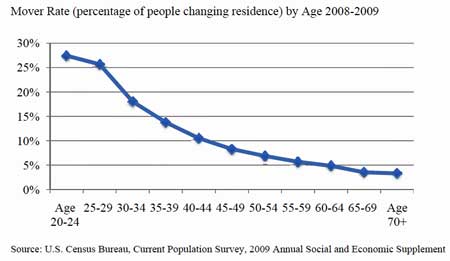
Here’s another graph, this time from the Census Bureau. It’s showing the ‘Mover Rate’ — which tells us who’s moving around out there. Again, it’s the under 35 set that’s moving the most. They are running around like chickens with their head cut off when what they should be doing is so simple: buy a home!
 Finally, here’s a non-comparative graph showing rates of homeownership, again by age:
 Again, it’s that under 35 set that has the greatest need.
So, it’s younger people who are moving around the most, who have the greatest NEED to buy, but who are pulling back from homeownership at a faster rate than anyone else! And all of this is happening at a time when interest rates are very low and housing is more affordable than it’s been in decades.
I sniff a sales challenge here. What are we saying to the under 35 set to get them interested in buying real estate? What should we be saying? Does the old rent vs. buy analysis still work? Or is it old hat? What’s it going to take to get these folks off the fence and back into the market?
I also believe it’s time for young people to step up and take responsibility for this mess! Clean it up! Young people: it is your DUTY to get out and buy a home this week. You don’t just owe it to yourself, you owe it to your ECONOMY! Personally, I think each of us should go out and find someone under 35 and just smack them! It’s all their fault!
