Differentiation: Four Key Metrics

As a Help-U-Sell broker, you rarely have to deal with tie-breakers when it comes to listing. Usually when the seller hears your superior offer and is satisfied that you can and will deliver, he or she is ready to sign.

But there are metrics you can introduce into the conversation whether you are competing with others for the listing or not, that will boost your credibility and differentiate you from the rest of the pack.

Average Days on Market. That means from listing to pending status. How many days of marketing did your average listing endure last year before buyer and seller agreed on an offer?  That’s powerful information when you compare favorably against your peers. If your average days on market is 57, and the MLS is 85, that means you are 28 days faster (better) at getting your listings sold than your competitors. That’s huge! But even 10 days is worth crowing about. And here’s a clue: you will almost ALWAYS beat the MLS on this and the other three metrics. It’s just the nature of ‘average’ – your individual average should be better than their aggregate average. In fact, if it’s not . . . well you probably have a big problem in your business.

Average Sale Price as a % of List Price. On average, are you getting your sellers 97% of List Price in a sale? Or are you getting 95.3%? If your average Listing Price is $255,000 and your average price of a sold Listing is $253,000, you’re getting 99.2% . . . not too shabby! Now run the same calculation for the MLS. If you discover that the MLS average is 94%, you’re able to tell your sellers that you usually get your clients more than 5% more for their property than your competitors! Which is probably MORE than they are paying you! Now that’s powerful!    And, once again, if you aren’t better than the MLS in this metric . . . well, you’ve got a bigger problem.  By the way, it’s important that you count only Listing Sides here; comparing your average Listing Price with your Average Sale Price (including buyer sides) skews the results.

Per Person Productivity.  Take your total number of closed sides for last year and divide it by the number of licensed people in your office.  If you had 62 closed sides and 3 licensees, your per person productivity is better than 20 closed sides per year.  Now, compare that with the MLS. You’ll be shocked.  That average will probably be in the 6 to 10 closed sides per year range.  Now, think like a consumer for a moment.  Who do you think is going to do a better job of protecting your interests, of staying abreast of changes in the industry and finance, of solving notty problems when they arise in a transaction:  the guy who does 7 closed sides a year or the one who does 20?  Want to blow that 200 agent mega-office out of the water?  Use this metric.  You’ll beat the pants off them every time.

Fallout Rate.  Of all the sales you made last year, how many fell out of escrow?  Calculate it as a percentage and then compare that with the MLS.  Your figure might be 10% and the MLS will almost always be higher, and sometimes significantly higher.  If the MLS is 16% you can demonstrate to a seller that they are more likely to make it to closing with you than with a typical broker.

Put it all together and what does it sound like?

‘Mr. & Mrs. Seller, last year it took me, on average, 57 days to get a listing under contract.  It took the MLS – which is every other broker – 85 days, which is almost a full month longer.  So when you list with me, chances are we’re going to get this process over with quicker.  I also got my sellers, on average,  99.2% of their Listing Price.  In the MLS right now they’re only getting 94%.  So I’m getting my Sellers more for their properties than they are actually paying me!  The average agent in my office closed 20 deals last year.  In the MLS, the average was 8.  I know that’s hard to believe, but it’s true.  Who do you think is better equipped to handle your transaction and solve problems when they arise?  Thank you.  Finally, last year only 10% of my sales fell through.  In the MLS it was 16%. Put plainly:  with me, you’re going to sell faster, for more money, with less likelihood of falling out of escrow, AND you’ll have the expertise of some of the most productive people in the local market making sure everything goes as planned.’

Slam Dunk.

Now:  DO IT.  Get out your calculator, log into MLS, and run the numbers.  And tell me what you find: I’m itching to share.

Using Zillow To Give Your Reputation A Boost

Hey! Check this out:

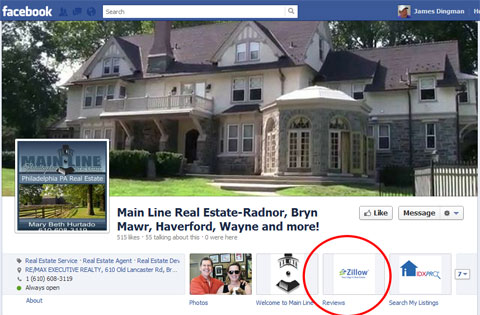
Here is an agent using Zillow Reviews (and she has plenty) on her Facebook Business Page. Pretty cool, huh?! Would you like to do this? It’s easy.

The first step is to get a bucket full of good reviews.  Go to Zillow and log in to your Agent account (of course, if you don’t have one of those, you’ll need to sign up, but it’s free).  Click on the down arrow next to ‘My Agent Hub’ and select your profile.  Just below your picture there, you’ll see a star and a link to ‘Request A Review.’  Click it.  Now, look below the form and click the link to ”Send Multiple Requests At Once’.  You’re now at a form where you can enter the email addresses of all your former clients!  Quick and easy.  I’d suggest you reword the actual request – what’s there is pretty formal.  But click the send button and give it a couple of days for results.

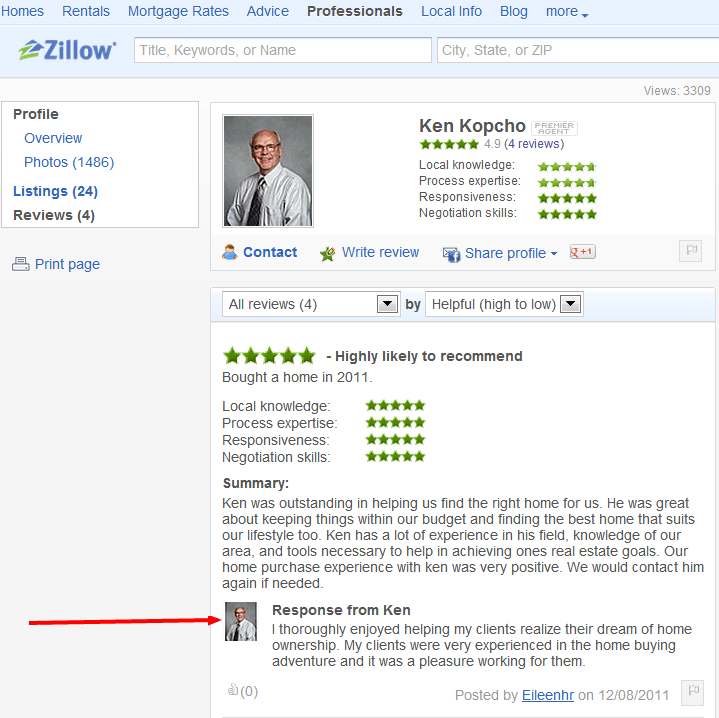
Those reviews will show up on Zillow and will be available there for everyone to see when they are trying to decide which agent to call.  Very powerful.  It gets even more powerful when you respond to the review, like Ken Kopcho did here:

(Great Job, Ken!)

Now, when you have your handful of great reviews, go back to Zillow, log in, Click the down arrow next to ‘My Agent Hub’ and select ‘Widgets/Facebook Apps.’  There you’ll find a link to ‘Real Estate Apps for Your Facebook Page,’ and the second one of those will put a new Tab on the front of your Facebook Business page, like this:

That new Tab will take your visitors to that wonderful page of reviews you saw in the first image. By the way, did you notice the other Facebook Apps Zillow has for you?  The Listings tab, Local Info tab and the Contact Form are all pretty cool and might also belong on your Facebook Business Page.

I learned this in about ten minutes on a Zillow Academy webinar this morning.  You really should check this out:  Zillow Academy.

So that’s it:  quick, easy and effective.  I’ve heard from so many of you that the Zillow Premiere Agent program produces LEADS, but I’ve also heard over and over that it is the agent with lots of wordy five star reviews that gets the call.  Now you can put some of that great power to work for you on Facebook!

State of the Housing Market, 2012: Good News

Confidence is up, rates are down, prices are increasing, pending sales are way up . . . I have to admit, it’s getting better, it’s getting better all the time (Lennon/McCartney).

NAR just released the slides their Chief Economist,  Lawrence Yun, used in his State of the Housing Market address at their mid-year meetings, May 14-19.  The 31 slide package is fascinating and DEEP, and you can view the entire thing HERE, but I want to reproduce six of the most powerful charts here on the Set Fee Blog.

First is the issue of affordability.  Housing is more affordable today than it’s been in years.  Really:  we’re talking pre-1970s affordability.

And, at the same time, mortgage interest rates are ridiculously LOW:

Note the projection of rising rates starting this year.  If history teaches us anything, this is good for housing sales.  In the past, slowly rising rates after a period of flatness pushed many fence sitters into the market, anxious to get the best rate before it’s gone.

This near tsunami of good news has contributed to a significant rise in REALTOR confdence:

It’s interesting to see the low point from July through October 2010.  That was the period immediately after the two housing stimulus tax credit programs.  As we all realized there would not be another similar program to bolster sales (and that the two we already had produced no long term benefit), we just got . . . depressed.  But by the end of 2011, our own economic Prozac had begun to kick in and now we’re nearly giddy.

Look what’s happened!  Pending contracts are rocketing upward at a magnificent pace!  We’re almost back to where we were at the beginning of 2007 when everything fell apart.

Pendings are nice, but mostly because they predict upcoming sales, and it’s sales that count.  Check out our Q1 2012 closed sales stat:

Breathe a sigh of relief:  it looks like steady recovery may be a reality.  But assuming no other catastrophy befalls us, there are still challenges in this improving market, notably in terms of inventory.  I can’t help crowing like a rooster, ‘I told you so! I told you so!’, but I did tell you we were looking at a housing shortage back in November and then in more detail in December.  That’s when the media was still sqwaking about how bad things were going to get when the mysterious ‘shadow inventory’ hit the market.  I am still not sure I believe in the shadow inventory, but it remains a topic of conversation.  Even Dr. Yun has a slide showing the continued rise in the numbers of homeowners 90 days or more late on their payments and/or in the foreclosure process.  I didn’t include that slide in my magnificent Six, but here is the state of new and resale inventory:

New homes for sale have been at a numbing flat line since 2009 and we’re getting back to 2006 levels on existing homes.  This one fact, coupled with the preceeding five slides tells me something very important:  if you have any notion about buying a home, you’d better get busy NOW.  Everything is picking up (including prices), rates are better than they will ever be, and the pool of houses to choose from is shrinking.  Be ready to bid against other buyers on your dream home:  I’m hearing more and more about multiple offers on good properties.  Don’t let that discourage you – the deals are still abundant – but if you snooze now, you’re probably going to lose.

Once again, if you’re interested in Dr. Yun’s full package of 31 slides, you can view it here.

Accessibility Toolbar