The Stupidest, Dumbest, Lamest, WORST Ad in Real Estate History

I don’t want to offend anybody.  I know a lot of really good Century 21 agents and a bunch of good Century 21 brokers.  But, come on!  The ads over the past several years have been so bad that they are embarrassing!  I mean look at the stupid thing that graces the back cover of the latest California REALTOR Magazine:

Century 21 Ad

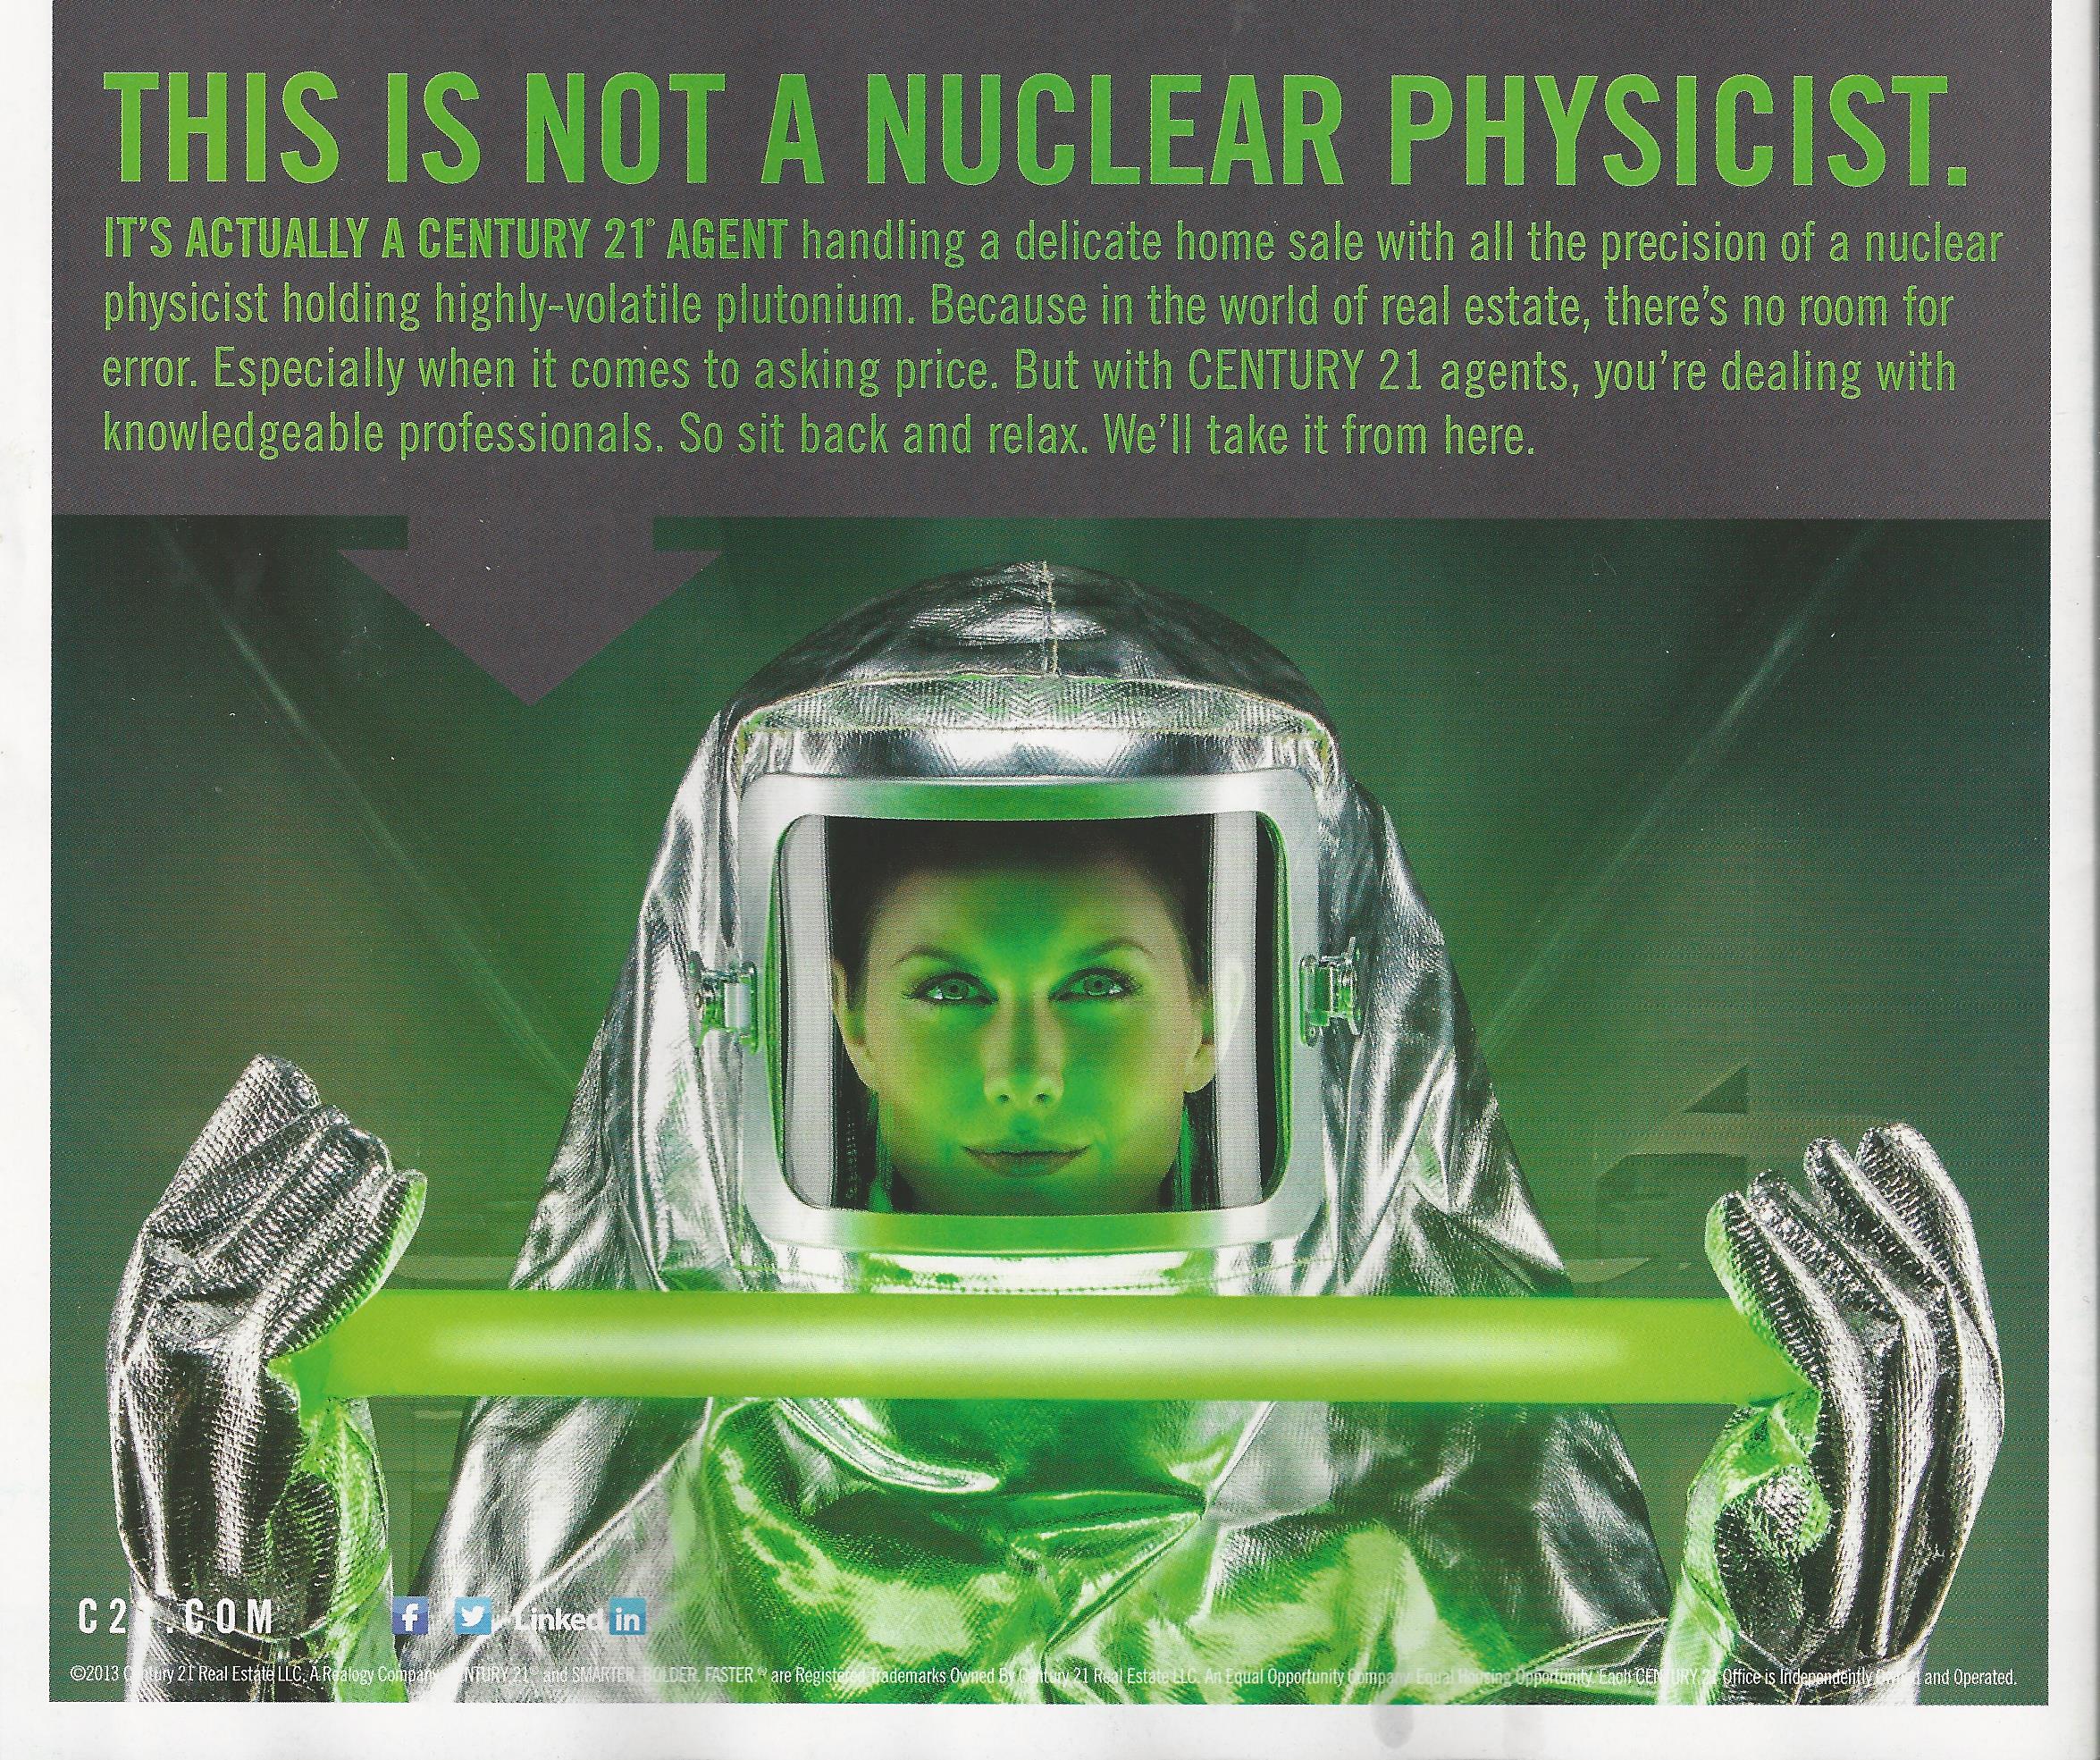
I guess this is an improvement over the ads in this series that ran over the past 3 or 4 years.  They featured beautiful actors and actresses smiling – or more often smirking – confidently at the camera, pretending to be Century 21 agents while glowing adjectives flowed below.  This ad makes no pretense at reality.  It’s a cartoon.  It’s a parody of the company’s own advertising.

If I were a Century 21 person (and I was for more than 20 years) I would be insulted, first by the color scheme.  There’s not one drop of gold in the damn thing.  Century 21 corporate declared war on gold sometime in the early ’90s (sad to say I was there and in on the discussions; I dissented).  But no matter what they’ve done, no matter how hard they’ve tried to eradicate it, to distance themselves from that color,  twenty years later THE PUBLIC still sees GOLD as Century 21’s color.

I watched an episode of ‘Breaking Bad’ last night – from the first season.  They wanted a real estate agent on screen to be easily identified as such.  What did they do?  Put her in a gold coat.  No question.  Instantly anybody watching knew that was a real estate agent.

That kind of brand equity is priceless.  And it’s very difficult to achieve.  Century 21 owned the color gold and blew it up . . . and replaced it with . . . Green?  No, Bilious Green?

But let’s take a wholistic view, too: let’s look beyond the bad color and the dumb message.  Where is this ad placed?  Back cover of REALTOR Magazine.  That’s a $50,000 – $75,000 pop, depending on how big the contract is.  The ad seems to be aimed at the buying and selling public . . . but it’s placed in a publication for REALTORS.  So it’s suppposed to be a recruiting ad?? Or are we just becoming a little unfocused in our old age?

Again, the first ads in this series really were recruiting ads.  The idea was by showing actors as bright, confident and beautiful Century 21 agents, failing agents at other companies would want to jump ship for a chance to be just like the ‘agents’ in the ad.  (With logic like that is there any wonder per person productivity at Century 21 is said to have been in decline for decades?).

So back to the placement of this ad:  I guess REALTORS seeing this ad are supposed to feel as if Century 21 agents have some kind of super-human advantage over them with buyers and sellers.  Really?  From this silly, embarrassing ad they are supposed to feel that?  If I were a competitor in the field, I’d put this ad in my listing presentation to illustrate to potential sellers how stupidly some real estate companies spend their money!

Listen:  I got a PhD in Branding and Marketing at Century 21 in the 80s and 90s.  I learned from legends like Bruce Oseland, Elaine Hamilton, Dick McKenna, Rick O’Neil, Don Martin, Marty Rueter and many others.  This was one of the things Century 21 did extremely well in the early days. They did it so well that, in the late 70s – early 80s, the effectiveness of their marketing was scary!  They pretty much owned the concept of ‘Real Estate’ in the consumer’s consciousness.

The monkeying with with brand that started in the mid-nineties and continues to this day has undone that once very special organization.  Today,  Century 21 stands for generic real estate at its most mediocre.  There is nothing special about the consumer offer (it’s just like everyone else’s), nothing special about the operating system (It’s an old -fashioned, percentage based, agent oriented model), and nothing special about the identity.  If the function of marketing is to express the culture of the organization . . . well, I guess this ad has succeeded because today, Century 21 stands for nothing.

And it breaks my heart.

Hey, all of you marketing scholars out there!  If you want a great case study on how to build a powerful brand and then systematically destroy it . . .well, here it is.

Footnote:  There is a Help-U-Sell logo on this blog.  It is a brand and operating system I happen to love.  I do not, however work for Help-U-Sell.  I did, but not now.  Please don’t assume that I speak for that organization or anyone in it.  This is my blog and my opinion; so if you are sharpening your arrows, aim them here. -JD

Dick McKenna: ‘You must massage your numbers until they throb’

Dick McKenna was my favorite real estate guru.  A degreed Industrial Psychologist who, early in life did Peace Corp type work in Latin America, he gravitated to real estate where he became intellectual conscience of Century 21.  Dick knew more about the business side of our business than anyone I’ve known before or since.  He was the first person I recall being alarmed when traditional brokers began paying higher and higher commission splits.

‘You don’t understand!’ he’d squawk, ‘It is virtually impossible to make a profit if you’re paying more than 68% on average to your agents!’  And he had the numbers to back it up.

Oh, how right he was.

Dick was really big on Marketplace Intelligence.  He wanted us to discover and dissect every morsel of information we could find about a market and then use what we learned to drive our business.  It was all very Help-U-Sell (we’ve always embraced market data as a decision making tool).  That’s where the quote in the headline comes from:  he said it once in a meeting of about 1,000 brokers.

One Help-U-Sell Broker who’s been massaging his numbers recently is Jeff Braun from Union Grove, WI.  Working with his production numbers and those of his MLS for calendar year 2010, Jeff learned the following:

In his local market, he has a 39% MARKET SHARE!

  • When he was the Listing Agent and NOT the Selling Agent, he got 102.30% of list price as sale price
  • When he was the Listing Agent AND the Selling Agent, he got 103.97%
  • When he was the Selling Agent and NOT the Listing Agent, his buyer clients bought property for 94.30% of list price.

Do you think anyone trying to decide who to work with in Union Grove, WI would be interested in these numbers?  Of course.  Obviously, working with Jeff is one sure way to ensure you do okay buying or selling a home.

My message is this:  it’s January, a great time to review stats from last year.  Get your numbers together in the following categories then compare your results with the MLS.  I promise you, you will almost always beat the MLS and sometimes you will beat the MLS by so much, it’s worth crowing about!  Check:

  • % of listings taken that sell
  • Days on market (listing to pending – from that point on time frames are largely out of your control)
  • Sale price as a % of list price for properties where you were the listing broker only, the selling broker only and both the listing and selling broker
  • Fall out rate on pending transactions
  • Anything else you can think of

Then (assuming you are better than the average bear in your area — and you are),  create a one page summary of what you find to use in your Listing Presentation.  Heck, if the results are really good, why not include them in your advertising? It’s information like this that will make your marketing throb.

How To Do It: Step 7 – Track Results

(This is an elaboration of ‘How to Rule the (Real Estate) World in 10 Easy Steps‘)

Now that you have listings, consumer awareness, leads and people to handle them, you can begin to track your true Market Share.  Up to now you’ve focused on a different metric:  Listing Market Share.  You wanted to have more than your share of listings and you wanted your inventory to always be expanding.  But true Market Share is about counting the income producing side of the business, closings.  Since each sale has two sides, a listing side and a selling side, and since you may capture 1 or 2 sides in any transaction you close, we count closed sides to determine Market Share.

It’s simple really.  Start by defining your arena:  what is the geographical area in which you want to have the greatest impact?  That’s your target market.  Determine the period you want to measure:  previous 12 months, last full year, last Quarter, Year-to-Date, whatever makes sense.  Now count the closed sides that occurred during that period in your target market.  Now divide the total sides your office  had in your target market over the same period by the first figure.  If you had 10 closed sides in April and the target market produced 100 closed sides, you had .10 or 10% Market Share.

There are nuances in calculating Market Share today.  You really ought to separate out REOs, whether you’re getting those listings or not.  It’s a different market with different parameters and expectations.  I think you might want to figure a closed sides market share based on REO properties only, especially if they account for a sizable portion of your market.  But keep that separate from you more general market share analysis.  You might further segment your market share analysis by sub-diving equity sales and short sales.  You may discover that you have a 10% closed sides market share and that 35% of your closed sides were from short sales while only 20% of the closed sides in the target market were short sales.  This could be a good thing if you’re working to distinguish yourself as the short sale specialist in the area.

Moving forward, check your market share three ways:  monthly, quarterly and Year to Date.  Record your results and keep a running record so that you can discern the trend.  You want to see steady, gradual increases in your share.

All that is very important and frankly, a little boring.  No, not boring . . . a little less exciting.  But tracking your metrics and managing your business by the numbers is exciting. Here are some ideas:

Look for a marketing angle to your Key Performance Indicators.  There are a handful of production stats on which you will almost always outperform your MLS.  These nuggets become very powerful when presented in marketing pieces and listing consultations.  You might discover, for example, that:

Your average sale price is 97% of your average listing price where the MLS is 92%.  That extra 5% is something to crow about.

Your average days on market is 87 where the MLS is 102.  (There are two ways to look at this:  listing date to pending date and listing date to close date.  Pick the one that looks best for you)

Your per person production is 2.58 closed sides a month where the average in the MLS is .3

85% of your listings eventually sell where it’s only 67% in the MLS.

Can you see how these statistical facts could be very impressive?  And really, if you’ll start tracking and comparing, you’ll find you almost always beat the MLS.  By the way, there may be other comparative metrics you might track and use, AND don’t forget to keep a running total of the dollars you’ve saved sellers (over a traditional commission).

Use KPI to identify areas in which you want to set goals and then track your results.  For example:

If you determine your average buyer agent takes six house showings to produce an accepted offer, set a goal to get to 5.5 in six months.  Think about that.  How would you go about doing it?  Training?  Requiring more previewing?  Having a contest?  I knew a great agent in another life who set a goal on this metric every year.  The year we talked she had just gone from 6 showings to 5 and she believed it was a reflection of how well she listened to her buyers and how well she knew her market.

You may determine that 20% of your transactions are in-house and therefore, 2 sided.  Maybe you decide you’d like to see 30% in six months.  How would you go about doing that?  Bonuses for selling company listings?  Working harder to get your listings priced right from day one? Increasing your showing fee or becoming a little more firm about when you will charge one?

Maybe your team is getting a buyer data sheet and contact information on 6 out of every 10 buyer inquiries.  Maybe you want to move that up to 7 out of 10 in three months.  What would you do?  I’m sure you’d do training and lots more role play on the incoming call, but what else?  Maybe a contest – once a month each person fielding buyer calls gets one chance to win for each Buyer Data Sheet he or she gets during the month.  First prize could be an Ipod or an elegant dinner for two or whatever!

I knew an amazing real estate consultant years ago.  He was actually an industrial psychologist who had gotten involved with one of the franchises early on and became a guide and mentor for the entire organization.  His name was Dr. Dick McKenna, and one of the things I remember him saying when he’d talk about tracking metrics and KPI was:

‘You have to massage your numbers until they throb!’


Ready for Step 8?

Accessibility Toolbar